
I must have spent too much time hearing the other Elecraft K3 owners talk about fancy precision oscillator stuff because when the idea got into my head that I could make a really ‘simple’ embedded NTP server with the bonus side-effect of a GPS disciplined oscillator, I could not get the idea out of my head. So that is my latest project. I started by reading loads of hardware spec sheets and looking at various required components. Then after I had a pretty good draft of what the plan was, I started ordering engineering samples. The hope was to do this with purchasing as little as possible in the way of parts. So far, I have acquired a good portion of the parts and hope to get a few more before I have to go get the rest on my own.
One of the things I DID purchase was a GPS device. I didn’t want any old GPS receiver, I wanted one that had a 10kHz output that is in sync with the 1 PPS output. Really this meant that I had to go with an older (used) model. But because they are a bit rare these days, that didn’t really save me much in the way of money. I was giddy when it came in the mail. I started poking at it. Documentation was scarce. Finally I figured out that it has an Oncore GPS core in it, which finally led me to some more detailed documentation about the serial interface. After that, it was just a matter of whipping up some software to read and write the necessary packets. Then the fun started. I started logging data and learned how to make use of some of it. I have a handful of commands that I use to set it up and receive location updates, satellite position, and leap second information.
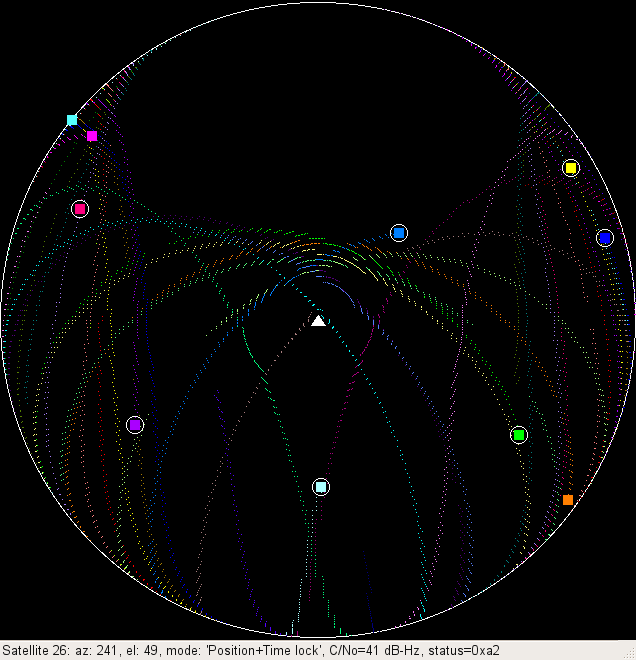
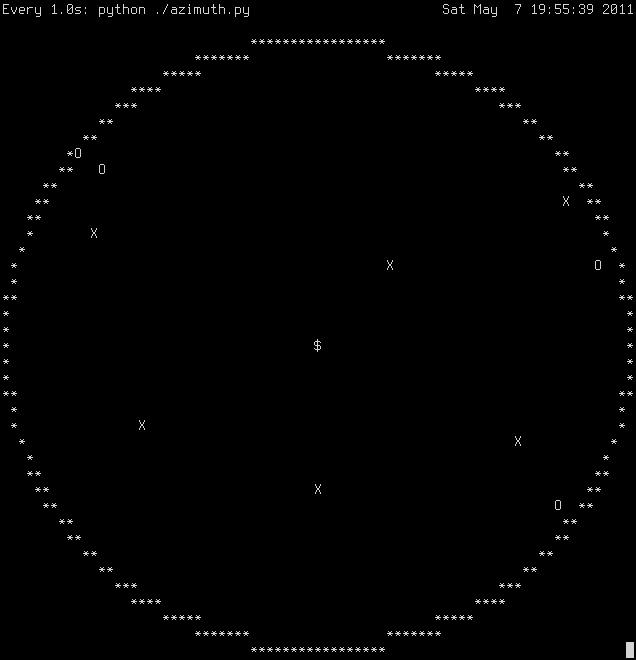
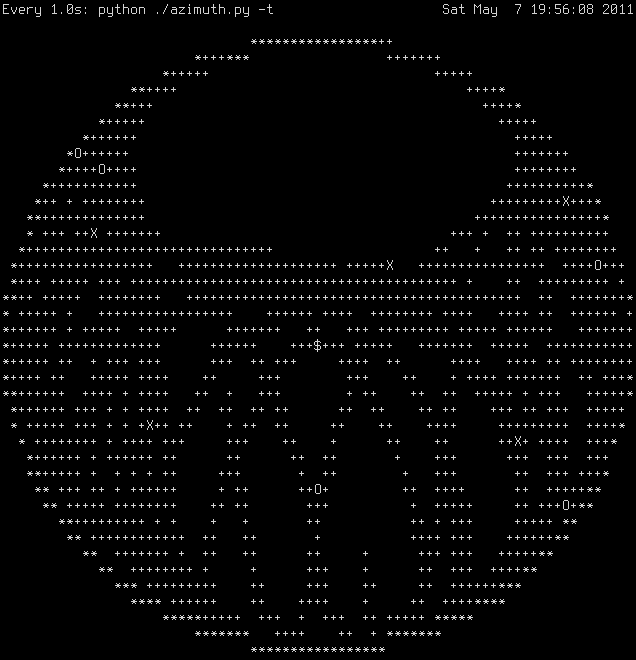
After looking at the location information that the receiver was providing, I moved on to the GPS location. Then I decided to make a tool to visualize the satellite positions. First I did this using ASCII art in the shell (which turned out surprisingly well). Then I added the traces of the satellite positions over the last 24 hours. This showed me some interesting things. First of all, it showed me that I had my plot wrong. (I had the north pole over in the east…. Ooops). Second, it was more a general coverage plot, since characters aren’t quite so precise as pixels. This convinced me to move on to a pixel-based plot, using pygtk. This one started out simple, but got fancier as I realized that it would be easy to add a feature here and a feature there. The gtk version lets you mouse over a satellite and it shows more detail about that satellite, like the ID number, lock status, azimuth and elevation, etc. It also shows the trails of the satellites in dots that are color matched to the squares that represent the satellites. If the satellite is locked, then there is also a circle around it. The plot updates in real time with the changes in the log file from the GPS device.